
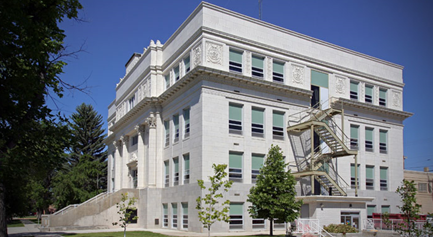
Hill County Courthouse - Havre, Montana
The History of Hill County
Formed February 28th, 1912 - Originally part of Choteau County
Population
16,673 (as of the 2000 census)
Land Area
2,897 Square Miles (approx. 50 x 57 miles)
Bordering Counties
Liberty County
Chouteau County
Blaine County
Canadian Provinces of Alberta and Saskatchewan.
Incorporated Cities:
Havre - County Seat, Incorporated 1893; population 9,621
(as of the 2000 census).
Hingham - Incorporated 1917; population 157 (as of the 2000 census)
Unincorporated Towns:
Box Elder
Gildford
Kremlin
Inverness
Rocky Boy
Rudyard
Population Distribution
6 People per Square Mile
Taxable Valuation as of 2010
$30,192,921
Class of County:
#1 - 2004 to present
#2 - 2003
#1 - 2002
#2 - 1979 to 2001
Population Data
Hill County
Population, 2010
16,096
Population, percent change, 2000 to 2010
-3.5%
Population, 2000
16,673
Persons under 5 years, percent, 2010
7.8%
Persons under 18 years, percent, 2010
26.8%
Persons 65 years and over, percent, 2010
12.7%
Female persons, percent, 2010
49.5%
White persons, percent, 2010 (a)
73.9%
Black persons, percent, 2010 (a)
0.3%
American Indian and Alaska Native persons, percent, 2010 (a)
21.7%
Asian persons, percent, 2010 (a)
0.4%
Native Hawaiian and Other Pacific Islander, percent, 2010 (a)
Z
Persons reporting two or more races, percent, 2010
3.3%
Persons of Hispanic or Latino origin, percent, 2010 (b)
2.3%
White persons not Hispanic, percent, 2010
72.9%
Living in same house 1 year & over, 2005-2009
81.1%
Foreign born persons, percent, 2005-2009
1.3%
Language other than English spoken at home, pct age 5+, 2005-2009
6.8%
High school graduates, percent of persons age 25+, 2005-2009
90.3%
Bachelor;s degree or higher, pct of persons age 25+, 2005-2009
20.0%
Veterans, 2005-2009
1,444
Mean travel time to work (minutes), workers age 16+, 2005-2009
12.3
Housing units, 2010
7,250
Homeownership rate, 2005-2009
67.8%
Housing units in multi-unit structures, percent, 2005-2009
17.0%
Median value of owner-occupied housing units, 2005-2009
$104,900
Households, 2005-2009
6,183
Persons per household, 2005-2009
2.58
Per capita money income in past 12 months (2009 dollars) 2005-2009
$21,760
Median household income, 2009
$40,778
Persons below poverty level, percent, 2009
19.1%
Source: Quickfacts.census.gov
Business Data
Private nonfarm establishments, 2009
538
Private nonfarm employment, 2009
5,311
Private nonfarm employment, percent change 2000-2009
11.8%
Nonemployer establishments, 2009
946
Total number of firms, 2007
1,197
Black-owned firms, percent, 2007
F
American Indian and Alaska Native owned firms, percent, 2007
9.4%
Asian-owned firms, percent, 2007
S
Native Hawaiian and Other Pacific Islander owned firms, percent, 2007
F
Hispanic-owned firms, percent, 2007
F
Women-owned firms, percent, 2007
28.7%
Manufacturers shipments, 2007 ($1000)
01
Merchant wholesaler sales, 2007 ($1000)
190,161
Retail sales, 2007 ($1000)
231,140
Retail sales per capita, 2007
$14,015
Accommodation and food services sales, 2007 ($1000)
23,819
Building permits, 2010
7
Federal spending, 2009
243,723
Geography Data
Land area in square miles, 2010
2,898.96
Persons per square mile, 2010
5.6
FIPS Code
041
Source: Quickfacts.census.gov